Hyper-Optimize Your Chatbots With User Flow Analytics

Data is the new oil of the 21st century. From giant multinationals to your local mom & pop, from sophisticated datasets to simple excel sheets — everyone (including us!) loves data.
Much like oil, data must be refined for it to have any value. For us, this meant building a data refinery that takes raw userflow data and converts it into the rocket-fuel of conversion rates.
And guess what? We did it!
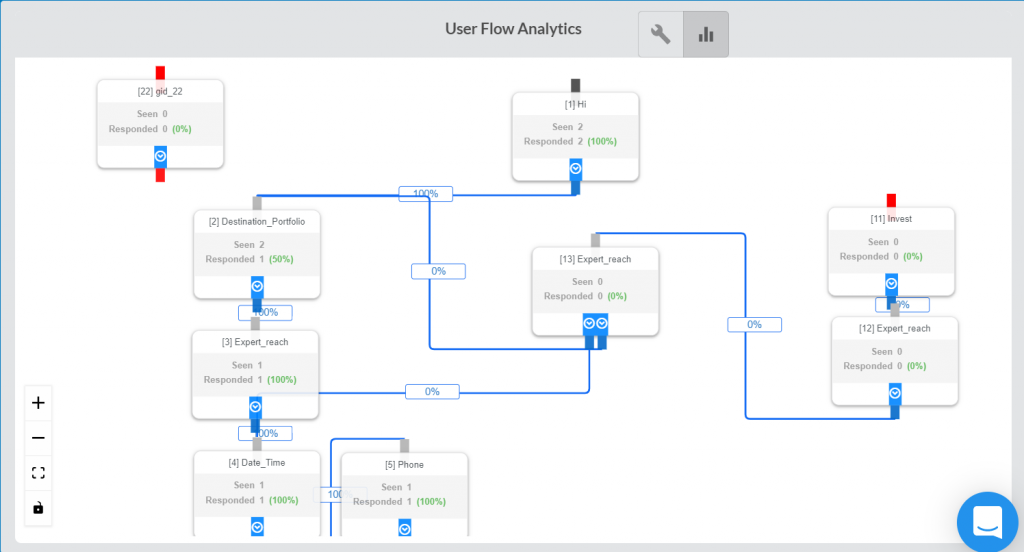
With our latest product update, businesses can now hyper-optimize their chatbots using a brand-new User Flow Analytics View that displays key engagement stats like no. of people who have seen, responded and dropped off for each gambit present in the latest published chatbot.
Why Should You Care About This Feature?
While userflow flow data has innumerable applications, its core function in the chatbot economy is helping businesses identity relevant patterns in their consumer behaviour, and reduce drop-off rates.
For example, if a marketing chatbot collects intrusive personal data before pitching its actual solution, users are likely to exit the conversation before they derive value.
With our latest product update, businesses can not only identify this critical pattern but also pinpoint the precise gambit that contains the conversational bottleneck for users.
How? By using these 3 Key Metrics in our User Flow Analytics View:
- Seen: That is, the total number of user views each gambit has received.
- Responded: That is, the total number of users who responded to each gambit.
- Dropped Off: % of users who dropped off from each gambit.
How Can You Hyper-Optimize Your Chatbots With User Flow Analytics?
In the world of chatbots, great technology can’t guarantee success. Why?
Because ultimately, a chatbot is only as good as its script. That’s why even the world’s smartest chatbot builder (a.k.a. Tars) works best when you leverage the magic of in-depth userflow insights!
It is these insights, at the gambit level, that help you analyse whether users are being incentivized or disincentivized from conversing with the chatbot.
What do these insights look like?
For example: a chatbot that constantly redirects customers without providing answers within the chatbot itself, is likely to tank the conversion rate!
How can you get this kind of insight from our new User Flow Analytics View? All you need to do is:
1️⃣ Head on over to the Make Section under Build Chatbot on the left sidebar
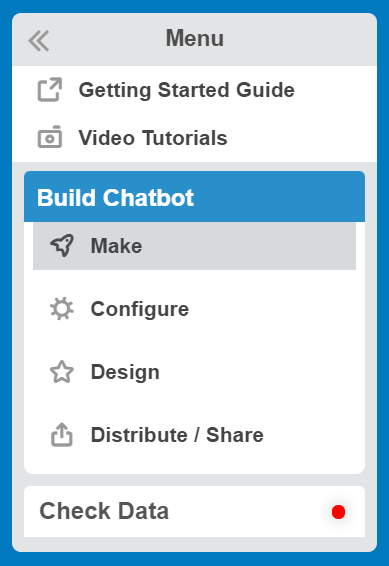
2️⃣ Toggle from Build View to User Flow Analytics View, as shown:
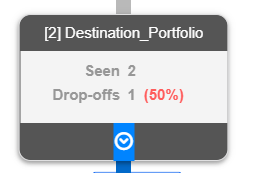
3️⃣ Analyze the gambits which have high drop-off rates – these are the conversational bottlenecks that need optimization!
4️⃣ Switch to Build View, and then click on the relevant gambit to modify its contents. Keep in mind your end goal: incentivize users to continue conversing with the chatbot.
5️⃣ Once you publish the optimized chatbot, don’t forget to check back in with the User Flow Analytics View to track how your chatbot is performing!
How to get started?
Book a demo with us today and an in-house chatbot expert will personally onboard you onto the new User Flow Analytics View along with every other TARS feature!

Soham is a content marketer on the Tars team. When he's not writing kickass blog posts like the one you just read he's reading obscure articles from history's foremost anti-enlightenment thinkers and writing treatises to send to his 3 substack subscribers.


Learn why businesses trust us to automate their pre-sales and post-sales customer journeys.
Recommended Reading: Check Out Our Favorite Blog Posts!
Recommended Reading: Check Out Our Favorite Blog Posts!
Resolve Complex Customer Queries With Tars Live Chat
Improve Your KPIs Using Tars WhatsApp Campaign Scheduling Feature

Supercharge Your Customer Engagement Using WhatsApp Ongoing Campaigns
Our achievements in numbers

7+
years in the Enterprise Conversational AI space

700+
global brands that we’ve worked with

50m+
customer conversations automated

10+
countries with deployed Chatbots